Cal Twomey penned this article today over on the AFL site . The article makes the point that the AFL’s new rule changes have already achieved their goal in reducing quarter lengths. This is despite only 20 quarters having been played across the 5 opening round games.
The AFL’s statistical illiteracy has been much derided on footy twitter and this article is no exception. To be generous to Twomey he seems aware that the sample size is very small, however, it is still far too small a sample size to draw any conclusions. To illustrate the point, I want to prove through a hypothesis test that the shorter quarters this week tell us little to nothing about whether the underlying distribution of quarter lengths has changed.
Method
Coincidentally this week, I have been porting over the ever brilliant Matter of Stats’ score progression simulator into Python. Part of this work includes fitting a distribution to quarter lengths. I’m not going to go into any detail here, but the Matter of Stats article is a must read for those who enjoy stats, you can read it here.
We assume that quarter lengths are normally distributed where the mean is a function of goals and behinds scored in the quarter. We need this assumption to account for the additional time in quarter lengths caused by delay following goals and behinds. Such that quarter length (in seconds) is distributed as
\[ Quarter Length \sim \mathcal{N}(Goals \cdot c_1 + Behinds \cdot c_2, \sigma^2) \]
Where \(c_1, c_2\) are the coefficients we will fit using an Ordinary Least Squares (OLS) model and \(\sigma^2\) will be the variance of the residuals.
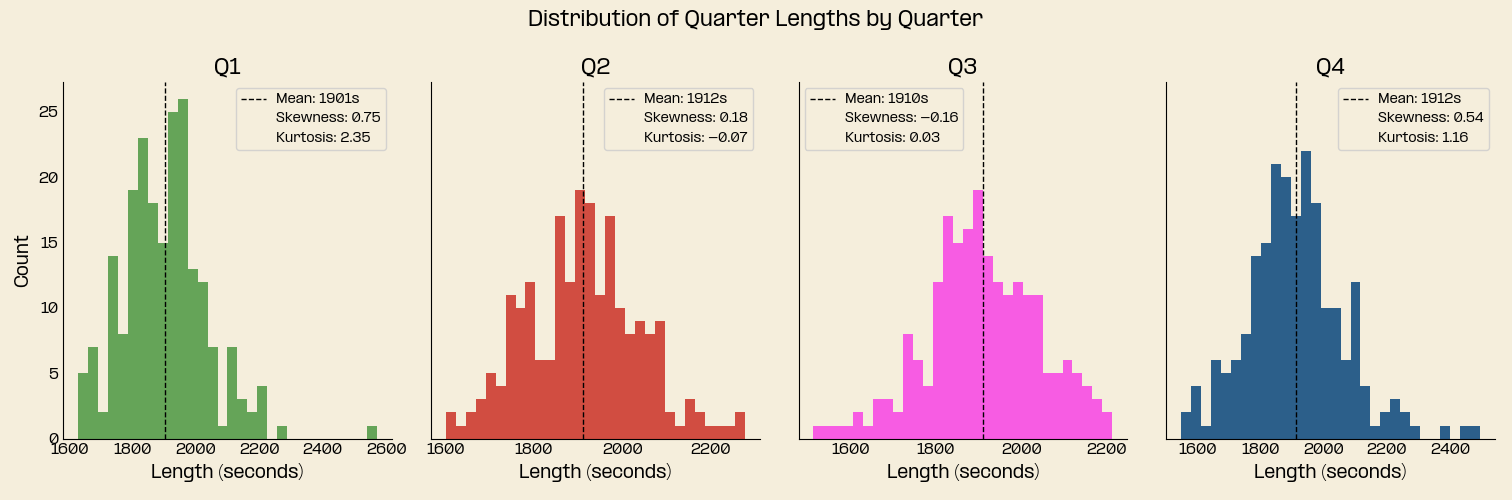
To get the coefficients, we fit the OLS to 2025 quarter length data using an 80/20 train/test split. We have a sample of 213 games and 852 quarters , there are 3 games missing from my dataset and hence 12 quarters, but we digress because this is only a quick analysis and we have a reasonable sample size. For reference, here is the distribution of quarter lengths in 2025 (1900 seconds is 31 minutes and 40 seconds):
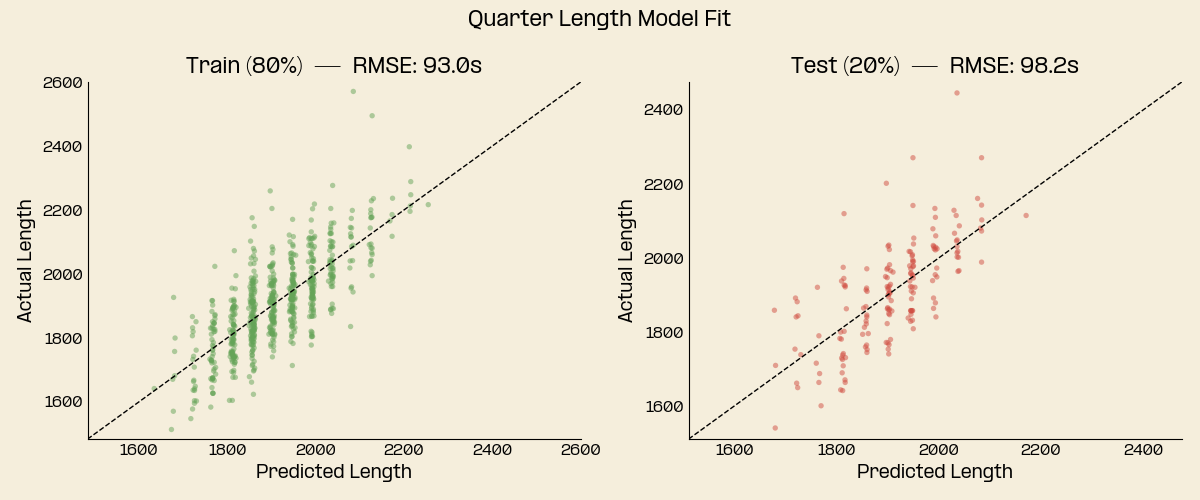
After fitting the model we get the below plot demonstrating the fit of the model given the number of goals and behinds in the quarter.
After fitting the model we aslo plot a QQ plot to check the distribution of residuals after applying the model.
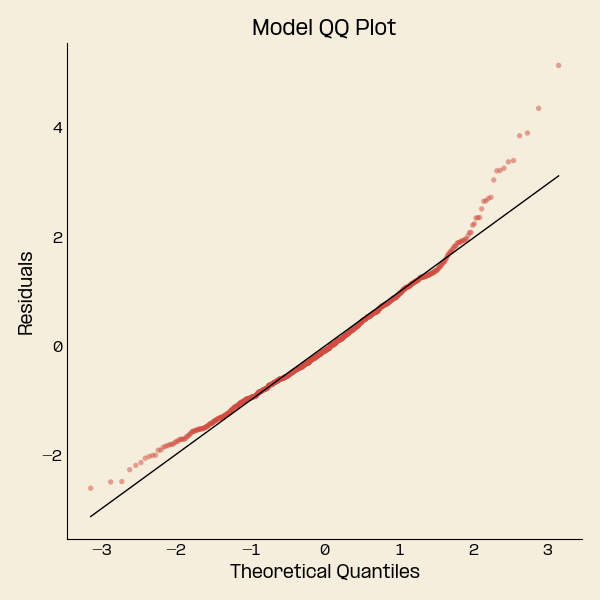
There appears to be some right skew in the data. This is not all that surprising given quarters are likely to be longer at times due to unmodelled circumstances, for example injuries or lightning delay. It also shouldn’t be much of an issue for testing 2026 quarter lengths because there were no significant delays in any of the quarters that I can recall, maybe some grappling between resets.
Hypothesis Test
We now move to testing whether the average quarter length in opening round is statistically shorter than an average quarter in 2025. The goal is to test two hypotheses for each quarter since the distributions are slightly different for each.
Null hypothesis: Is the mean quarter length in 2025 the same as the 2026 mean quarter length sample?
Alternative hypothesis: Is the mean quarter length in 2026, less than in 2025?
To answer these we conduct a t-test to determine how likely it would be to draw the observed opening round quarter lengths given the model for 2025. After conducting a t-test we get the following table with p-values:
t-test results
| Q1 |
5 |
1950.0 |
1949.1 |
+0.9 |
0.010 |
0.9921 |
| Q2 |
5 |
1835.8 |
1876.0 |
-40.2 |
-1.558 |
0.1196 |
| Q3 |
5 |
2076.8 |
2080.2 |
-3.4 |
-0.032 |
0.9748 |
| Q4 |
5 |
1889.8 |
1910.2 |
-20.4 |
-0.271 |
0.7867 |
| All |
20 |
1938.1 |
1953.9 |
-15.8 |
-0.370 |
0.7112 |
Since none of these p-values are below 0.05 we cannot reject the null hypothesis for any quarter.
So in short, no, quarters in opening round were not shorter than the average 2025 quarter based on the sample size.
To get a little bit more into detail, given the difference in average quarter length in opening round compared to the average quarter length in 2025, we would need to see 1136 observations to say that these reductions were statistically significant.
Furthermore, given the sample size of 5 for each quarter, the table below shows how many seconds shorter each quarter would have needed to be compared to 2025 to be considered statistically significant. Which given the sample size is quite alot.
Reduction in observed quarter length needed for statistical significance
| Q1 |
255.7 |
| Q2 |
71.5 |
| Q3 |
300.4 |
| Q4 |
210.3 |
Conclusions
The long and short of this post is that it is way too early to claim that the AFL’s new rules have shortened the length of quarters. This post is also not meant to discredit or make fun of Cal Twomey, the AFL audience at large doesn’t expect a journalist to have a detailed understanding of statistics. Nonetheless, why the AFL continues to pursue data driven reporting without better statistical analysis is beyond me.
Also, having been to a couple of the opening games myself, it did feel like the new rules kept the time between play shorter. Whether quarters get shorter as a result? Only a bigger sample size will tell.